


Nexgen Digital Twin + Analytics for Buildings
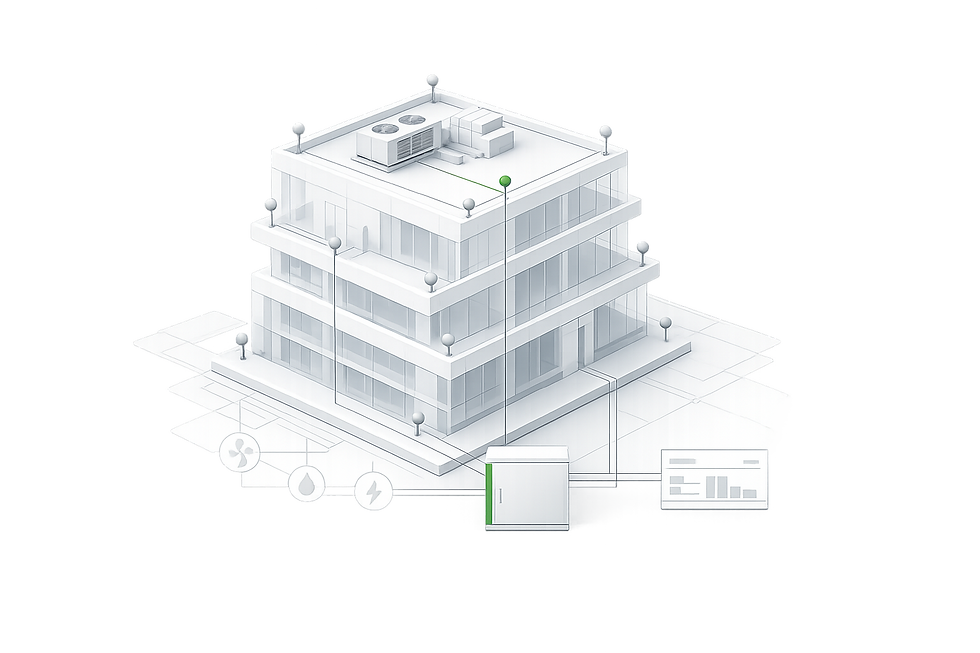
Digital Twin + Analytics is the visibility and verification layer of NexGen Smart Buildings. It starts with a twin-ready BIM model structured for operations (asset-level organization, naming standards, and system relationships), then connects that structure to live telemetry from BAS/BMS, meters, and sensors. The objective is not “dashboards in general.” It is an operational twin that can be commissioned, validated, and used to diagnose issues, track performance, and optimize outcomes over time.
Digital Twin + Analytics integrates directly with Microgrid + Controls, Wind/Solar/Storage, BAS/BMS, IAQ + Environmental Sensing, Cybersecurity / Data Governance, and (where used) Robotics. This integration enables consistent telemetry schemas, KPI definitions, alarm/event histories, and lifecycle records so operations teams inherit usable, decision-ready data—not binders.

Systems Library
NexGen buildings are engineered as integrated systems. Explore the energy, controls, sensing, digital twin, and security modules that can be combined into an energy-independent smart building.

On-site wind generation integrated into the building’s energy system to reduce grid dependence and support resilient operations.

Roof and site photovoltaics paired with controls to deliver clean power and predictable performance.

Battery and storage strategies that smooth peaks, increase resilience, and enable islanding when needed.

A coordinated microgrid architecture that manages generation, storage, loads, and grid interaction in real time.
Controls-ready integration that connects building systems, sensors, and equipment into a unified management layer.

Continuous monitoring of air quality and comfort signals to improve health, performance, and operational response.

A twin-ready model connected to live data for visibility, diagnostics, and performance optimization over time.

Secure, permissioned data architecture with auditability to protect systems, users, and lifecycle records.

Automation pathways for inspection, maintenance, and operations—designed to integrate safely with building systems and workflows.

Functional Scope (What Digital Twin + Analytics Does)
Primary functions (project-dependent):
-
Twin-ready model structuring (BIM → Ops)
Asset hierarchy, naming, and metadata rules so model elements map cleanly to real equipment, zones, and systems. -
Asset + system graph mapping
Equipment ↔ zones ↔ meters/sensors ↔ control points mapping that makes telemetry interpretable and actionable. -
Telemetry normalization + historian readiness
Time-synced point naming, units, sampling intent, retention rules, and data-quality checks so analytics are defensible. -
Dashboards + role-based views
Energy, IAQ/comfort, utilization, equipment health, alarms/anomalies, and system status—configured to stakeholder needs. -
Diagnostics + anomaly detection workflows
Baseline → trend → anomaly → root-cause workflow with evidence and traceability (what changed, when, and why). -
Performance optimization loop
Continuous improvement via setpoint/schedule recommendations, exception tracking, and verified “before/after” outcomes. -
Lifecycle record + auditability (where required)
Durable change history for models, KPIs, and operational events; optional Web3 verification where audit trails matter.
Twin Architecture + Analytics Loop
Digital twin value is defined by measurable structure and repeatable workflows:
-
Asset structure
What is an asset, how it is named, and how it relates to systems and spaces. -
Point/telemetry schema
Which signals matter, how they are labeled, what units apply, and how they align with KPIs. -
KPI definitions + thresholds
What “good” looks like (targets, bounds, exceptions) and how the math is calculated. -
Baselines + comparisons
Seasonal baselines, operational modes, and comparators (model vs measured; before vs after). -
Exception handling
Clear routing: flag → classify → assign → verify correction → document outcome. -
Change control
Model updates, retuning, and system changes captured as lifecycle events so performance history stays interpretable.
System Interfaces (Required Integration Points)
Digital Twin + Analytics is designed to interoperate with NexGen systems through explicit interfaces:
-
BAS/BMS: points list, schedules/modes, alarms, setpoints, trend logs, sequences of operation alignment
-
IAQ + Environmental Sensing: thresholds, alerts, comfort indicators, calibration/validation markers
-
Microgrid + Controls: PCC metering, mode states, dispatch events, export limits, island-ready events
-
Energy systems (wind/solar/storage): production/curtailment states, charge/discharge states, constraints
-
Cybersecurity / Data Governance: segmentation, identity/access control, logging, retention, and secure data handling
-
Robotics (where used): evidence packages, event tags, time/location stamps, and structured outputs for the twin
Design Inputs (Twin Feasibility + Data Constraints)
Digital twin feasibility and analytics quality are driven by measurable inputs:
-
BIM completeness + asset intent
Asset naming standards, model LOD/LOI intent, and what must be represented as an operational asset. -
Owner/operator objectives
Top KPIs (energy, IAQ, resilience, uptime, lifecycle cost), reporting needs, and decision cadence. -
Controls + telemetry availability
Point exposure (what’s readable/writable), trend frequency, and alarm/event access. -
Metering + sensor coverage
Where measurement exists (and where it doesn’t), calibration intent, and accuracy requirements. -
Data architecture
Network segmentation, time sync requirements, historian/retention intent, and integration boundaries. -
Success metrics + acceptance criteria
What constitutes “usable twin handover” (mapping completeness, data quality, dashboard correctness, workflow readiness).
These inputs are established during Discovery + Feasibility and become the basis for mapping rules, dashboards, analytics workflows, and commissioning acceptance.
Commissioning and Verification
Digital Twin + Analytics is commissioned as an operational subsystem with defined acceptance criteria.
Commissioning scope typically includes:
-
Asset mapping verification
Model-to-asset alignment, naming compliance, and relationship graph correctness. -
Point mapping verification
Tag/point alignment, units validation, sampling intent, and time sync confirmation. -
Data quality verification
Completeness, latency, dropouts, outlier handling, and retention checks. -
Dashboard + KPI validation
Math verification, threshold logic, and role-based view correctness. -
Scenario verification
Known events (mode changes, dispatch events, alarm triggers) appear correctly in histories and dashboards.
Acceptance criteria examples:
-
Verified asset registry + mapping coverage for defined scope (systems and critical assets).
-
Validated telemetry schema (names, units, time sync, retention) with defined data-quality thresholds.
-
Verified KPI math and dashboard correctness against sample datasets and known scenarios.
-
Confirmed anomaly workflow produces traceable evidence (flag → cause → correction → verified outcome).
-
Confirmed lifecycle logs capture changes so performance history remains interpretable over time.
Digital Twin Deliverables
Digital Twin + Analytics produces consistent, operations-ready outputs:
-
Twin-ready model package
Asset-structured BIM with naming standards and required fields. -
Asset data dictionary
What each field means, who owns it, and update rules. -
System relationship map
Equipment ↔ zones ↔ meters/sensors ↔ control points mapping. -
Dashboards
Energy, IAQ/comfort, equipment health, utilization (as applicable), alarms/anomalies, and mode status. -
Event + alarm histories
Time-stamped lifecycle record of modes, exceptions, and key operational events. -
Analytics loop artifacts
Baselines, trend reports, anomaly logs, corrective action tracking, and verified “before/after” results.
Process
Digital Twin + Analytics in NexGen is implemented as a repeatable workflow that turns BIM into an operational, measurable system.
The process begins with Twin-Ready Structuring, where asset hierarchy, naming, and required fields are established so the model can function as an operations dataset. Next, Integration Mapping connects BAS/BMS points, meters, and sensors to the asset graph with consistent telemetry schemas and time sync requirements.
Then Dashboards + KPI Definitions translate raw telemetry into decision-ready views with validated KPI math, thresholds, and role-based reporting. Finally, Continuous Analytics + Verification runs the baseline → trend → anomaly → corrective action loop so performance stays verifiable and improvements remain documented without losing traceability.
Across all stages, the system produces consistent outputs: dashboards, KPI histories, event logs, exception reports, and commissioning-ready verification artifacts.

Case Studies
Digital Twin + Analytics Integration Across NexGen Prototypes
(Operational Use-Cases)
OpDez integrates Digital Twin + Analytics across the NexGen prototype library as an operationally repeatable pathway—so each concept is designed from day one with a twin-ready asset structure, consistent telemetry schemas, and KPI outputs that support real-world operations.
Digital Twin + Analytics is treated as the verification layer for NexGen performance: it converts coordinated design intent (systems + controls + targets) into measurable operations data that can be monitored, diagnosed, and improved without losing a durable change history.
*Proprietary uses not listed

Bird Feather
Digital Twin + Analytics Use-Cases
-
Energy performance visibility: track on-site generation, storage behavior, and load profiles with KPI dashboards.
-
Vertical-system operations: monitor high-rise critical assets (core MEP, vertical transport, life-safety dependencies) as mapped assets.
-
Exception detection: flag drift in energy balance, comfort, or equipment health vs baseline.
-
Commissioning continuity: carry functional test results + trend logs into post-occupancy verification.
-
Lifecycle record: mode changes, alarms, and corrective actions logged into the twin.

Sky Lotus
Digital Twin + Analytics Use-Cases
-
System relationship modeling: equipment ↔ zones ↔ sensors mapping for clear diagnostics at scale.
-
Air + comfort analytics: IAQ/comfort signals trended against occupancy and operating modes (project-dependent).
-
Performance benchmarking: compare floors/zones for efficiency and comfort variance detection.
-
Operational tuning: verify “before/after” impact of scheduling and setpoint changes.

Cobra
Digital Twin + Analytics Use-Cases
-
Systems integration dashboard: consolidate BAS/BMS, IAQ, and energy telemetry into one operational view.
-
Anomaly workflow: detect exceptions → classify → track corrective actions with evidence.
-
Operational readiness: commissioning-ready point mapping + validated KPI math for handover.
-
Audit-ready histories: time-stamped event logs aligned to cybersecurity/data governance requirements.

Double Cobra
Digital Twin + Analytics Use-Cases
-
Paired-structure analytics: compare tower-to-tower KPIs to isolate drift, imbalance, or equipment degradation.
-
Shared-mode tracking: monitor synchronized operating modes and exceptions across both structures.
-
Maintenance prioritization: trend asset health and direct interventions using verified performance deltas.

Falcon Eye
Digital Twin + Analytics Use-Cases
-
Reliability focus: uptime/availability tracking for mission-critical systems (scope-dependent).
-
Alarm integrity: verify alarm routing, categorization, and response documentation.
-
Evidence-based operations: maintain a traceable record of anomalies and verified resolutions.

Cloud Machine
Digital Twin + Analytics Use-Cases
-
Concept-to-ops traceability: connect performance assumptions to measurable telemetry once systems are defined.
-
Commissioning validation: confirm mapping completeness, dashboard correctness, and baseline creation for future optimization.
-
Data-quality readiness: validate time sync, retention intent, and exception handling rules.

Urban Stream
Digital Twin + Analytics Use-Cases
-
Pilot-ready twin: fast deployment of asset mapping + dashboards for a compact systems stack.
-
Energy + comfort verification: baseline → anomaly → corrective action loop for measurable operational improvement.
-
Simple handover: provide usable, organized operations data (not binders) for facility teams.

NOAH
Digital Twin + Analytics Use-Cases
-
Resilience tracking: monitor autonomy-related KPIs (energy availability, critical load continuity and project-dependent).
-
Mode + constraint visibility: record operational states and exceptions for post-event review.
-
Field-verifiable outcomes: document “before/after” tuning and repairs with measured results.
